
A Framework For Understanding Sources of Unintended Consequences in Machine Learning
Harini Suresh and John Guttag. 2019. A Framework For Understanding Sources of Unintended Consequences in Machine Learning.This paper provides six sources of harm spanning from data to model in machine learning. They posit the focus solely on data as incorrect, as the entire pipeline of ML involves human decision-making and thus bias can be introduced. The categories of bias they introduce are not exclusive and may overlap. They also offer some mathematical mitigations for aggregation and representation bias.
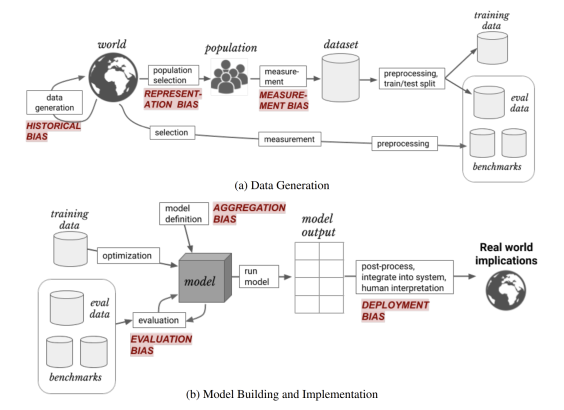
Machine Learning Pipeline
Where problems can arise...Data collection: "Data collection involves selecting a population, as well as picking and measuring features and labels to use"
Data preparation: "Depending on the data modality and task, different types of preprocessing may be applied to the dataset before using it. Datasets are usually split into a training data used during model development, and testing data used during model evaluation. Part of the training data may be further set aside as validation data."
Model development: "A number of different model types, hyperparameters, and optimization methods may be tested out at this point; usually these different configurations are compared based on their performance on the validation data, and the best one chosen. The particular performance metric(s) used in such comparisons are chosen based on the task and data characteristics; common choices are accuracy, false or true positive rates (FPR/TPR), and area under the receiver operating curve (AUC)"
Model evaluation: "Aside from the testing data, other available datasets – also called benchmark datasets – may be used to demonstrate model robustness or to enable comparison to different existing methods. As in model development, choosing well-suited performance metric(s) is important."
Model postprocessing: "Once a model is ready to be used, there are various post-processing steps that may need to be applied. For example, if the output of a model performing binary classification is a probability, but the desired output to display to users is a binary answer, there remains a choice of what threshold(s) to use to round the probability to a hard classification"
Model deployment: "Importantly, there is no guarantee that the population a model sees as input after it is deployed looks the same as the population it saw during training and evaluation. We will refer to these two populations as the development population and use population, respectively. The development population can be further split into training population, testing population, and external benchmark populations, that are used at different points during a model’s training and evaluation."
Sources of Harm
Historical bias: A misalignment between reality and the values encoded in a model. It exists even with perfect sampling and feature selection. The bias stems from how the world is, or was when the data was collected. A classic example is crime data being disproportionately weighted against minority groups. Societal biases can be amplified in machine learning models, which then contribute to furthering the bias (e.g., there are few women CEOs, so the ML model only returns images of male CEOs, furthering the perception women cannot be CEOs).Representation bias: Occurs in the sampling, underepresenting part of the population and failing to generalize well. It can arise in two ways: (1) The sampling methods only reach a portion of the population, so they become underrepresented in the dataset; and (2) the population has changed or is distinct from the training population, such as trying to generalize from one locale to another.
Measurement bias: Happens during feature selection and labeling. They can be proxies for desired labels or features (e.g., arrest rates as a proxy for crimes committed). The chosen set of features or labels might leave out important characteristics or "introduce group- or input-independent noise that leads to differential performance." Proxies may also be measured differently across groups (differential measurement error). The authors name three ways measurement bias occurs: (1) The measurement process differs across groups, like when some groups are monitored in more detail than others and thus wind up in the data more often; (2) The quality of the data varies across groups, like when structural discrimination in medical settings leads to lower diagnoses in women; and (3) The defined classification task is oversimplified, such as using simple labels as proxies for complex predictions.
Aggregation bias: Happens during the model construction phase "when distinct populations are inappropriately combined." A one-size-fits-all model is designed to be used for differential groups. It can lead to models that do not work on any groups, or fit only to the dominant population when combined with representation bias. When important factors influence the outcomes for different subgroups, a one-size-fits-all model is likely not to work well on any subgroup.
Evaluation bias: Occurs in the model iteration and evaluation phases when "testing or external benchmark populations to not equally represent the various parts of the use population." It can also arise when the performance metrics aren't appropriate to real world use. "A misrepresentative benchmark encourages the development of models that only perform well on a subset of the population. Evaluation bias ultimately arises because of a need to objectively compare models against each other." This can lead practioners to overfit to specific benchmarks, which are not necessarily representative.
Deployment bias: When a system is used or interpreted incorrectly or not as intended.
Fairness Definitions
Group-independent predictions: "require that the decisions that are made are independent (or conditionally independent) of group membership. For example, the demographic parity criterion requires that predictions are uncorrelated with the sensitive attribute."Equal metrics across groups: "require equal prediction metrics of some sort (this could be accuracy, true positive rates, false positive rates, and so on) across groups. For example, the equality of opportunity criterion requires equal true positive rates across groups"
Individual fairness: "requires that individuals who are similar with respect to the prediction task are treated similarly."
Causal fairness: "place some requirement on the causal graph that generated the data and outcome. For example, counterfactual fairness requires that there is not a causal pathway from a sensitive attribute to the outcome decision"